Wednesday, August 3, 2011

Ontario election 2011 prediction (early August edition)

Click to enlarge. Outline by S. Smith.
When I got back from my cottage trip yesterday, I found out that there was a new poll put out by Forum Research for the Ontario election. So, that means another projection for the election. I will continue my Toronto series on another date.

The poll was very interesting. It saw the Tories take a bit of a hit, and they are down to 38% from 41% from the last Forum poll. This may be attributed to Hudak's controversy surrounding abortion. The Liberals gained two points, and are now up to 28%, while the NDP also gained 2 points up to 24%. The Greens were down one to 7%.

From now on, my projections will also come with projected percentages as well. This will also be shown on the map, with darker shades indicating a higher projected vote total for the winning party. Gray will still mean a toss up, indicating the riding's leading party is within 3 percentage points from the next party.

This is my first attempt at making percentage projections. I have looked at each riding individually and tried to figure out what its voters might do in the upcoming election. For this, I looked at the riding history, and tried to come to a conclusion as to why certain parties did as well they did, or as poor as they did compared to other years. For certain ridings, I assumed a uniform swing, because I felt its historical voting trends follow the provincial voting trends. For other ridings, I looked at the results of the recent federal election and adjusted the results to reflect the most recent poll. And for other ridings, I could only make estimates, again using past election data. It all depended on the charactar of the riding.

Of course, there is bound to be some oversights on my part. If you think I have a riding wrong, please let me know. I want to get this as right as possible. The key to making correct projections is not all about the math. Rather, it's about the local conditions. That's why I will be looking at qualitative data just as much as I will be looking at quantitative.

Alas, here is how I see things:


Riding Lib PC NDP Grn
Ajax—Pickering 42 39 13 6
Algoma—Manitoulin
29
24 43 4
Ancaster—Dundas—Flamborough—Westdale
30
45
17
8
Barrie
21
51
19
9
Beaches—East York
16
22
51 11
Bramalea—Gore—Malton 36
31
27
6
Brampton West
37
41
15
7
Brampton—Springdale
37
39
18
6
Brant 36 36
21
6
Bruce—Grey—Owen Sound
19
52
16
13
Burlington
24
50
18
8
Cambridge
20
48
24
8
Carleton—Mississippi Mills
29
51
13
7
Chatham-Kent—Essex
23
48
24
5
Davenport
31
11
52 6
Don Valley East 38
33
23
6
Don Valley West 45
41
9
7
Dufferin—Caledon
18
53
11
18
Durham
22
51
19
8
Eglinton—Lawrence 42 42
10
6
Elgin—Middlesex—London
21
51
22
6
Essex
19
43
34
4
Etobicoke Centre 44
38
13
5
Etobicoke North 47
27
22
4
Etobicoke—Lakeshore 38
37
18
7
Glengarry—Prescott--Russell 45
37
13
5
Guelph 37
28
15
18
Haldimand—Norfolk
18
64
15
3
Haliburton—Kawartha Lakes—Brock
31
50
13
6
Halton
28
50
15
7
Hamilton Centre
21
20
51 9
Hamilton East—Stoney Creek
21
32
42 5
Hamilton Mountain
30
27
39 4
Huron—Bruce
34
39
21
6
Kenora—Rainy River
23
36
39 2
Kingston and the Islands 40
32
21
7
Kitchener Centre 39
34
20
7
Kitchener—Conestoga
34
42
18
6
Kitchener—Waterloo
28
46
18
8
Lambton—Kent—Middlesex
33
42
18
7
Lanark—Frontenac—Lennox and Addington
30
45
19
6
Leeds—Grenville
19
60
15
6
London North Centre 38
29
23
10
London West 39
34
18
9
London—Fanshawe
26
28
31 5
Markham—Unionville 42
34
20
4
Mississauga East—Cooksville 41
37
17
5
Mississauga South
40
43
11
6
Mississauga—Brampton South
39
40
16
5
Mississauga—Erindale
37
42
15
6
Mississauga—Streetsville 40
38
14
6
Nepean—Carleton
26
53
14
7
Newmarket—Aurora
29
50
13
8
Niagara Falls
35
38
17
10
Niagara West—Glanbrook
16
59
19
6
Nickel Belt
24
21
52 3
Nipissing
34
47
16
3
Northumberland—Quinte West
33
39
19
9
Oak Ridges—Markham
33
46
15
6
Oakville
40
41
12
7
Oshawa
10
45
36
6
Ottawa Centre
28
22
42 8
Ottawa South 44
32
17
7
Ottawa West—Nepean
38
40
17
5
Ottawa—Orleans 42
40
12
6
Ottawa—Vanier 41
26
25
8
Oxford
18
55
19
8
Parkdale—High Park
23
15
54 8
Parry Sound—Muskoka
14
53
22
11
Perth—Wellington
39
40
14
7
Peterborough 35
33
24
8
Pickering—Scarborough East 41
35
17
7
Prince Edward—Hastings
32
42
21
5
Renfrew—Nipissing—Pembroke
17
68
12
3
Richmond Hill 39
39
15
7
St. Catharines
37
38
19
6
St. Paul's 44
30
20
6
Sarnia—Lambton
18
49
28
5
Sault Ste. Marie 46
21
30
3
Scarborough Centre 37
32
27
4
Scarborough Southwest 34
26
33
7
Scarborough—Agincourt 46
33
18
3
Scarborough—Guildwood 39
32
25
4
Scarborough—Rouge River 51
23
23
3
Simcoe North
19
56
16
9
Simcoe—Grey
17
57
14
12
Stormont—Dundas—South Glengarry
23
56
16
5
Sudbury 45
17
34
4
Thornhill
30
56
10
4
Thunder Bay—Atikokan
28
25
44 3
Thunder Bay—Superior North
36
15
44 5
Timikaming—Cochrane
29
21
48 2
Timmins—James Bay
24
26
48 2
Toronto Centre 43
22
27
8
Toronto—Danforth
24
13
53 10
Trinity—Spadina
26
16
48 10
Vaughan 48
36
11
5
Welland
18
35
41 6
Wellington—Halton Hills
21
59
11
9
Whitby—Oshawa
20
52
20
8
Willowdale 41
38
15
6
Windsor West
18
26
51 5
Windsor—Tecumseh 36
27
31
6
York Centre
37
44
14
5
York South—Weston
35
17
42 6
York West 51
17
28
4
York—Simcoe
18
55
17
10

Conclusion
These numbers give us a Tory minority.  Just like in the federal election, the provincial election will see much of the electoral fighting happening in the Greater Toronto Area. This is the area that I have made the most projection changes in. 11 of the 20 ridings that are too close to call are in the GTA.

While the Tories are looking at a minority right now, they could still potentially win up to 61 seats, if they win all of the toss ups. The maximum number of seats the Liberals can win at this point is 46, which is still shy of a majority. The NDP is looking at a maximum of 21 seats, which would be the highest since they formed government in 1990.


Party Projected seat totals (toss ups included in table) Change from last projection Projected seat totals (toss ups excluded from table)
PC 42 -14 50
Liberal 27 (+9) 34
NDP 18 n/c 20
Toss ups 20 (+5) 3 (ties)

Tuesday, July 26, 2011

2011 federal election poll maps: Toronto (part 3)

Click to enlarge.  Map credit: Shilly
Continuing with of my 4 part series analyzing Toronto's poll map from the 2011 federal election. (see part 1 and part 2)

Part 3 will wrap up my analysis of Toronto's riding. Part 4 (which will be on a later day) will look at some demographic maps of the city to compare with the poll maps.

Toronto Centre
The only break in the NDP's sweep of Toronto's lakefront was in Toronto Centre. Demographically, the riding is very diverse. It consists of Toronto's gay friendly Church and Wellesley area, it contains Canada's most dense neighbourhood in St. James Town- which is also very poor. It also includes the very affluent Rosedale neighbourhood in the north of the riding and part of Toronto's Bay Street financial district.

Liberal MP Bob Rae was the winner here in 2011, earning 41% of the vote. He lost a lot of support though from his 54% showing in 2008, which included an 18,000 vote lead over the Conservative candidate. However in 2011, it was the NDP that finished 2nd, coming within 6,000 votes of Rae. Despite Rae's somewhat comfortable margin, he actually won less polls than the NDP candidate. The NDP's strength in the south of the riding and dismal performance in the affluent north was contrasted by the opposite for the Conservatives. The Liberal vote was more spread out however, meaning strong seconds across the riding gave Rae the victory.

In 2008, the Liberals nearly swept the riding in their support. They lost just six polls. 5 to the Tories in affluent areas such as Rosedale and Yorkville, and one to the NDP. However, 2011 was much different. As mentioned, Liberal support was more spread out across the riding. They won much of their poll in the middle of the riding, separating the Conservative north and NDP south. Their best neighbourhoods were in Summerhill, Cabbagetown, Downtown and the southern part of Rosedale. Cabbagetown and Regent Park, to its south were the Liberal's best neighbourhoods in 2008. However, Regent Park, Canada's first social housing neighbourhood, swung heavily to the NDP in 2011.The NDP won much of the south of the riding, including Regent Park, the Garden District, Church & Wellesley, St. James Town and St. Lawrence. All areas picked off from the Liberals. The Tories meanwhile expanded their support in the affluent neighbourhoods in the north of the riding, like Rosedale, Moore Park and Yorkville. Again, all at the expense of the Liberals.

Toronto--Danforth
This is NDP leader Jack Layton's riding. Jack won every single poll in 2011, and won nearly every poll in 2008. He won over 60% of the vote in 2011, up from 45% in 2008. This mostly meant cementing soft NDP polls into stronger polls. Layton's best neighbourhood in both elections was the working class Leslieville area, where he won a majority of votes in almost every poll. The NDP's worst polls were in Riverdale, Greektown and Old East York, which were the only neighbourhoods with polls where they won less than 50% of the vote. These were also the only areas where the Liberals won polls in 2008.

Trinity--Spadina
Trinity--Spadina is the riding of Layton's wife Olivia Chow. Chow won 54% of the vote in 2011, and won all but four polls in the far northeast of the riding. The 2008 race was much closer between her and her Liberal opponent, which she only beat by 3,500 votes. Before the "orange wave", some pundits predicted the increase in condo development in the riding would make this riding a Liberal pickup.  However, Chow beat the same Liberal, Christine Innes by over 20,000 votes in 2011- a swing of 12.5% from the Liberals to NDP.

In 2008, the NDP won most of the poll in the riding, but most with less than 40% of the vote. The Liberals won polls scattered across the riding, with a cluster in the northeast corner of the riding, which is known as "The Annex", a relatively affluent and educated neighbourhood. The Tories also won one poll in The Annex, and two polls on the Harbourfront. The NDP's best neighbourhood was the multicultural Kensington Market area.

In 2011, the NDP won a majority of the vote in most of the polls, with their best area being the Kensington Market again, and neighbouring Chinatown (Chow is Chinese). The Liberals won three polls in the Annex, and the Tories held on to their one poll there, but lost their Harbourfront polls.

Willowdale
One of the many Tory pickups from the Liberals was in the riding of Willowdale. Liberal MP Martha Hall Findlay lost by just 1,000 votes to the Conservative candidate, Chungsen Leung. She had beaten the Conservative candidate by 8,000 votes in 2008.

Willowdale is fairly homogenous in its voting patterns. Hall Findlay's victory in 2008 allowed her to win most of the polls. The closeness of the 2011 race meant that both the Tories and Liberals won polls across the riding. The Conservatives' best neighbourhood in both 2008 and 2011 was in the north end of the Bayview Woods-Steeles. This is where they won 5 polls in 2008.  The Tories also did well in Hillcrest Village, Newtonbrook, and the eastern half of the Willowdale neighbourhood in 2011. The Liberals won the western half of Willowdale and Bayview Village. Other neighbourhoods were more mixed. The NDP won one poll, the one containing Seneca College.

York Centre
The same result occurred in neighbouring York Centre, which the Tories also picked up, on a similar 10.3% swing from the Liberals. Liberal MP Ken Dryden went down to defeat, losing by over 6,000 votes to Conservative Mark Adler. The Conservatives had targeted this riding, having only lost it by 2,000 votes in 2008.

Unlike Willowdale, York Centre is much more polarized politically. The riding is separated in two parts thanks to the Downsview Airport which is right in the middle of the riding. The eastern portion, which has more people, voted heavily Conservative, while the smaller western portion voted heavily Liberal. Dryden was able to win in 2008 by winning parts of the eastern part of the riding, while winning every poll in the west.

The western part of the riding is called Downsview, and has large Black, Italian and Latin American populations. The Tories made inroads here in 2011, by winning a handful of polls. The eastern part of the riding is divided up into many smaller neighbourhoods- all of which voted heavily Tory. In 2008, the Tories only won Armour Heights and the Westminster-Branson neighbourhoods. The Tories have been making inroads among the high Jewish population in this riding, which allowed them to pick up Bathurst Manor and hold onto Westminster-Branson. They also won the neighbourhood of Wilson Heights.

York South--Weston 
York South--Weston is an old NDP seat, held federally by former leader David Lewis in the 1960s and 1970s, and by the provincial CCF/NDP for most of the period between 1943 and 1996. However, it has been a fairly safe Liberal seat ever since. In recent years, the NDP has been targeting the party once again, acquiring it provincially in a by-election in 2007- only to lose it in the general election later in the year. So, when the orange wave came to town in 2011, it only made sense for this riding to be swept up from the Liberals to the NDP.

2011 faced a rematch between NDP candidate Mike Sullivan and Liberal MP Alan Tonks. Tonks defeated Sullivan in 2008 by over 6,000 votes. However, Sullivan won by less than 3,000 votes in 2011, benefiting from a 13% swing from the Liberals to the NDP.

In 2008, the Liberals won most of the polls in the riding, but the NDP had concentrated support in the southern half of the Weston neighbourhood, and in the diverse Mount Dennis neighbourhood. Liberal support was strongest in the northeast part of the riding, roughly northeast of Black Creek. When the tides turned in 2011, it was this part of the riding (the Maple Leaf and Amesbury neighbourhoods) that stuck with the Liberals.  The NDP strengthened their support in Weston, but also in the south part of the riding where they were nearly shutout in 2011. They also made inroads in the area between the CN Railway and Black Creek. The Tories won six polls in 2011, having been shutout in 2008.

York West
Perhaps one of the safest Liberal seats in the country now is York West. The Liberals have held this seat in 1962. York West is one of the poorest ridings in the country, and is home to the infamous "Jane and Finch" area.

York West's MP, Judy Sgro won this seat by over 5,000 votes, which is a considerable amount considering the low turnout in this riding. Sgro won by nearly 12,000 votes in 2008 and was able to win all but one poll in the riding. The NDP won that poll, which is located at York University. In 2011, the NDP expanded on this one poll by winning the whole York University area, and a handful of polls in other parts of the riding. The Tories were also able to win three polls of their own. The Liberals however still won most of the polls in the riding. Their best neighbourhood was Humber Summit in the northwest corner of the riding, an area with a high Italian and South Asian population.


Stay tuned for part 4!

Thursday, July 21, 2011

2011 federal election poll maps: Toronto (part 2)

Click to enlarge
Continuing from Part 1, in my analysis of the city of Toronto's poll map from the 2011 federal election.

Once again, thanks to Shilly from the US Elections Atlas Forum who made this map, and allowed me to use it here on my blog.

Parkdale--High Park
Much like neighbouring Davenport, Parkdale--High Park is a new riding for the NDP, which won it for the second time in history in 2011. Former MP and NDP President Peggy Nash defeated the (formerly?) popular Liberal incumbent Gerrard Kennedy in a rematch from 2008. Nash had first won the riding in 2006, but Kennedy, fresh off of a 4th place finish in that year's Liberal leadership race swooped in from provincial politics to claim the seat back for the Liberal Party. He had previously represented the riding in the Ontario Legislative Assembly. It was one of the few NDP seat losses in 2008. Losing by over 3000 votes in 2008, she won it back in 2011 over 7000 votes with a swing of 10.7%.

Like the riding name suggests, Parkdale--High Park generally consists of two parts. Parkdale in the east, and High Park in the north. Parkdale, a working class neighbourhood, is more NDP friendly and High Park more Liberal friendly. In 2008, the Liberals were able to win by nearly sweeping High Park They also swept the neighbouring Swansea neighbourhood to its south, some of The Junction, to the north of High Park and Roncesvalles Village to the west of Parkdale. They also won a few polls in Parkdale, although Kennedy did not win the neighbourhood. In 2011, Nash won every singly poll Parkdale, racking up high percentages in Parkdale Village specifically. She also won all but two polls in neighbouring Roncesvalles Village. She was also able to win the eastern half of High Park, and won almost every poll in The Junction. Swansea was more of a mix between the Liberals and NDP, as was Bloor West Village, on the west side of High Park.

Pickering--Scarborough East
Pickering--Scarborough East is in the far eastern end of Toronto, and is only partly in the city. The eastern half of the riding is in Pickering. This seat was an unexpected pickup for the Tories who had lost the riding by 8,000 votes in 2008. The Conservative candidate, Corneliu Chisu won the seat in 2011 in a close race, winning by 1,200 votes, benefiting from a 9.9% swing. He defeated the incumbent, Dan McTeague who had been in office since 1993.

The riding showed its true polarized colours in 2011, with the Scarborough half voting Liberal and Pickering voting Conservative. This is especially interesting considering McTeague is from Pickering, and has only represented part of Scarborough since the last redistribution in 2004. McTeague's victory in 2008 was quite overwhelming, winning nearly every poll in both parts of the riding. The Tories only won a few polls, in clusters in both parts. In 2011, most of the riding turned blue, with Chisu winning almost every poll in Pickering. He won many polls in Scarborough too, especially south of Ellesmere Rd and the 401, where he won almost every poll in Rouge Hill and won most of the polls in Port Union. North of this area however, voted Liberal, with the NDP winning three polls of their own.

Scarborough--Agincourt
Scarborough--Agincourt is one of the "safer" Liberal ridings in the city. The Liberals, who used to routinely get over 60% of the vote here, could only muster 45% of the vote. MP Jim Karygiannis defeated his Conservative opponent by 4,500 votes. Nearly 3 quarters of the riding is visibly minority, with 2 fifths of the population being Chinese. With the Tories making inroads with the immigrant communities, this riding could be in play in future.

In 2008, the Liberals won all but a small handful of polls  here. In 2011, they won a strong majority of the polls again- but the Tories won a larger handful. The Liberals are a bit stronger in the north part of the riding- north of Finch, where they only lost three polls. Perhaps the strongest Conservative area was a number of apartment buildings in the Agincourt Mall area which they won. I'm not sure why though. The best the NDP could do was tie one poll, in the same area.

Scarborough Centre
One of the best three way races in the city was found in Scarborough Centre. Conservative candidate Roxanne James won the seat with just 35.5% of the vote. Liberal MP John Cannis won 32% of the vote, and the NDP was in a close third at 29.9%. The 2008 race here was much more boring however. The Liberals won nearly every poll with 48.7% of the vote.

Compared to the 2008 map, the 2011 map of the riding is very blue- but very light blue. While only getting slightly over a third of the vote, Ms. James was able to win a majority of polls. The riding really has no neighbourhoods that liked one particular candidate. The Conservatives had their best showing in Bendale which was their best area in 2008, and also had a strong showing in Wexford. The Liberal vote was also scattered across the riding, but their best area was perhaps Wexford as well. The NDP did the best in the southeast part of the riding, along Eglinton and in Wexford Heights.

Scarborough--Guildwood
Scarborough--Guildwood could also be characterized as a three way race as well. Liberal MP John McKay managed to win the riding by just 700 votes with 36.1% of the vote. The Conservatives received 34.5% of the vote and the NDP had 26.6% of the vote. McKay had won the seat easily in 2008 with 50.2% of the vote, and 7,000 votes more than his Conservative opponent. In 2008, McKay won almost every poll in the riding. The Tories were relegated to a few scattered polls and cluster in the east end of the riding at East Point.

In 2011, the Tories won most of the polls, despite losing the race. This is because the Liberal vote was more concentrated in places like Woburn, which has a high Muslim and Hindu population. The Conservative vote was more evenly spread across the riding. They only received majorities in 4 poll, three of which were in the Morningside area.The NDP won a scattering of polls, with their best showing in the Scarborough Village neighbourhood.

Scarborough--Rouge River
Scarborough--Rouge River was another surprise seat on election day. NDP candidate Rathika Sitsabaiesan won 40.5% of the vote and won 5000 votes more than her closest rival. In 2008, the NDP was a distant third place in a safe Liberal seat. The Liberal incumbent, Derek Lee did not run for re-election, leaving this seat up for grams. This riding has a large Tamil population, and has the largest Hindu population in all of Canada. The NDP ran a young Tamil candidate in Sitsabaiesan, and it proved to be a great choice for the party.

In 2008, the Liberals won every single poll in this riding. In 2011, the party finished third, and only won a handful of polls. The 2011 election showed a division in the riding, with the NDP winning in the east, and the Conservatives in the west, with the division at Markham Rd. The neighbourhoods of Malvern and the new Morningside Heights have a large south Asian population. It is therefore no surprise that the NDP was able to win these two neighbourhoods. The Tories just won two polls east of Markham Rd, and the Liberals won just five. West of Markham Rd., the NDP still won many polls, but the Conservatives clearly won. This part of the riding is less South Asian and more East Asian, a constituency that is less NDP-friendly.

Scarborough Southwest
Another three way race in Scarborough was in its southwestern riding. This time the split benefited the NDP candidate in Dan Harris. Harris increased the NDP vote in the riding by 16.3%, and defeated his closest rival by 1,300 votes. The Liberal MP, Michelle Simson finished third with 29% of the vote and the Conservatives finished 2nd with 32% of the vote.

The NDP win in the riding was also a surprise, but the party has held it before; but not since the early 1970s. It has voted NDP provincially as recently as 1990. However, if you look at the 2008 map, an NDP victory here would seem quite far fetched. The NDP won just three polls in that election. The Liberals won most of the polls across the riding, and the Tories won a few scattered polls here and there, and were able to win the neighbourhood of Cliffcrest near the Scarborough Bluffs.

Flash forward to 2011, and the Liberals are the ones with only a scattering of polls. Most polls in the riding were won with percentages in the 30s for all three parties. The NDP's strongest areas were Scarborough Junction and Oakridge where they won most of the polls, with a few even over 50%. The Conservatives again did their best in Cliffcrest where they won all but one poll which they lost to the Liberals. It appears as though only the NDP was able to get over 50% of the vote in any polls. The rest of the riding had a fairly even mix of NDP, Conservative and Liberal polls.

St. Paul's
Liberal MP Carolyn Bennett won her riding of St. Paul's by less than 5,000 votes in 2011. This was much closer than her 12,500 vote victory in 2008. St. Paul's is another one of those polarized ridings in central Toronto. While it is a fairly safe Liberal seat, one cannot ignore that big blue blob in the middle of the riding. That blob- which is the very wealthy Forest Hill neighbourhood- doubled in size in 2011. By that I mean, the the amount of polls that voted Conservative. In 2008, the Tories just won in Forest Hill, but in 2011, they had expanded their poll wins by claiming the nearby Cedarvale and South Hill neighbourhoods.

In 2008, the Liberals won the rest of the riding pretty easily, with their best showings in Davisville, Casa Loma and Bracondale Hill. In 2011, the Tories and the NDP began to eat away at these polls. Not only did the Tories expand their Forest Hill blob, they gained polls in the east end of the riding, like in Davisville. Meanwhile, the NDP, which didn't win any polls in the riding in 2008, won a large handful of them in 2011. The NDP vote seems to have spilled across the borders of nearby Davenport and Trinity--Spadina. It's in these border regions that the NDP won most of its polls in St. Paul's.


Stay tuned for part 3!

Wednesday, July 20, 2011

2011 federal election poll maps: Toronto (part 1)

Click to enlarge
If you've been following my twitter feed (which I just added to the site), you will know that last night, Shilly, a member of the US Election Atlas Forum released the poll by poll map of the entire city of Toronto from the May 2011 election. He has given me permission to re-post his map here, which I cannot thank him enough for, as it is drool-worthy for anyone who is as obsessed with Canadian election maps as I.

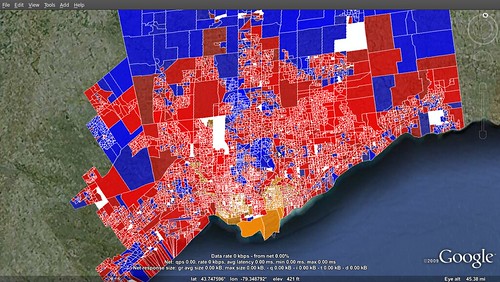
But now is the hard for me. Trying to make sense of this map. Compared to 2008, the map is much more blue and orange, and less red. The Conservatives picked up 9 ridings in the city in 2011, after having won none in 2008. The NDP picked up 6 ridings in the city. All 15 of these seats came at the expense of the Liberals. The Liberals were relegated to certain immigrant communities heavily concentrated in the northwest part of the city and in parts of Scarborough. The NDP expanded on their traditional lakefront ridings, by nearly sweeping the region, and also picked up the riding of Scarborough--Rouge River which has a high Tamil population. The Tories won in more upper class regions and in Scarborough.

Riding by riding analysis
Map of the ridings in Toronto. It's missing Pickering--Scarborough East (on the east side of the map) which was included in Shilly's map.

Beaches--East York
This riding was held by the Liberals, but the NDP picked it up on a swing of 9.9%. While the riding is a safe NDP riding provincially, federally it has been allusive for the party, having failed to win it in 2008 when they ran a star candidate in former MPP Marilyn Churley (who had represented neighbouring Toronto--Danforth). The NDP won the riding even with a lesser known candidate in Matthew Kellway, who won by over 5000 votes.

The NDP won most of the polls in the riding, but saw their highest percentages in the central part of the district, between Kingston Rd and Cosburn Ave (Woodbine Heights and Upper Beaches). This region was their strength in 2008 as well, even though the Liberals still won more polls there. The Liberal vote was spread around the riding more, picking up a few polls in the far north and south of the riding. Their strongest poll was in the highly multicultural neighbourhood of Crescent Town. The Conservatives won at least 12 more polls than their previous one poll in 2008. They won all but one poll in the fairly wealthy Parkview Hills neighbourhood, a few polls in Woodbine Gardens, and won four lakefront polls in the southwest corner of the riding.

Davenport
Davenport is another riding the NDP picked up from the Liberals. The riding has been targeted by the NDP in recent years, but 2011 marks the first time it has ever voted NDP on the federal level. The area has a large Portuguese population, and in recent years has seen in influx of young adults moving into the riding. The NDP ran an excellent campaign in the riding, running star candidate and former punk rocker Andrew Cash.  The NDP gained the seat with a huge 20.2% swing from the Liberals, defeating incumbent Mario Silva.

Politically, Davenport is polarized between north and south divided by the CP Railway. The north is where there Liberal support is the strongest, while the south is where the NDP support is strongest. In 2008, the Liberals won the south part of the riding, but it was the only part of the riding where the NDP won polls. In 2011, the reverse happened, where the Liberals not only did not win a poll south of the CP Railway, they did not win any polls south of St. Clair Ave. Liberal polls were concentrated in the heavily Italian and Portuguese neighbourhoods of Fairbank and Earlscourt. The further south in the riding, the more NDP it is, with the party making inroads into Little Portugal. The strongest neighbourhood for the party was Dufferin Grove, which is a working class neighbourhood. This neighbourhood in particular has a lot of young adults living in it.

Don Valley East
Don Valley East was a surprise pick up by the Tories in 2011. The lost the 2008 election by roughly 6,500 votes. However, Conservative candidate Joe Daniel was able to overcome this deficit by defeating the Liberal MP, Yasmin Ratansi by less than 900 votes. The NDP did fairly well in this riding, getting 25% of the vote here. 

In 2008, the Liberal vote was spread fairly evenly across the riding, winning most of the polls. Tory support was concentrated around the Donalda Golf & Country Club, and parts of the Parkwoods and Victoria Park Village. In 2011, the Conservative expanded their support in these neighbourhoods, sweeping most polls there. They also made inroads north of the 401, where they won just 2 polls in 2008. They won most of the polls in the neighbourhood of Henry Farm, and did very well in Don Valley Village and Pleasant View.

Liberal support was more concentrated in 2008. They were relegated mostly to the area north of Van Horne Ave. in the Don Valley Village, they won a handful of polls in Pleasant View, and continued to win most of the polls south of Eglinton Ave, in the far south of the riding - which is where their best poll was.

The NDP, which did not win a single poll in 2008, picked up quite a few in 2011. NDP polls were concentrated in 5 areas: on the north side of Eglinton Ave, a few polls in the Don Mills area, along York Mills Rd., the eastern part of Henry Farm, and around the "peanut" in Don Mills Village.

Don Valley West
Don Valley West was another Conservative pick up from the Liberals. The riding is very polarized between the two parties. Both the 2008 and 2011 elections were fairly close. Liberal MP Rob Oliphant won in 2008 by less than 3000 votes to the Conservative John Carmichael. They had a rematch in 2011, where Carmichael edged out Oliphant by 600 votes.

In 2008, the Conservative vote strength is concentrated in the wealthy York Mills, Bridle Path and Lawrence Park neighbourhoods. Liberal support was concentrated in Bedford Park, North Toronto, Don Mills, and Flemingdon Park. The neighbourhood of Leaside was mixed between the two parties. The densely populated working class neighbourhood of Thorncliffe Park was won by the Liberals, but the NDP also won many polls.

In 2011, the Tories made inroads in many of these Liberal communities. They won over the neighbourhood of Leaside, nearly swept Don Mills and made gains in Bedford Park and North Toronto. Liberal support held firm in the south end of the riding in Flemingdon Park an Thorncliffe Park where they gained all of the NDP polls (the NDP candidate was noticeably absent during the campaign). The NDP won one poll in 2008, at the corner of Bayview and the 401- which I believe is an apartment building.

Eglinton-Lawrence
Eglinton-Lawrence was one of the top 2 targets for the Tories in the city. They had only lost by 2,000 votes in 2008. In a rematch between the Liberal MP, Joe Volpe and the Conservative candidate, Joe Oliver, the Tories picked up the seat, winning by 4,000 votes.

When you look at the map poll by poll map of the riding, you can easily see how polarized it is. Nearly everything west of Allen Rd. was won by the  the Liberals, and everything east by the Tories. This is not completely true of course, as the area east of Avenue Rd. was very good for the Liberals as well (south of Lawrence).

In comparing the 2008 and 2011 maps, one change in this riding is glaringly evident. It seems almost all of the polls in the neighbourhood of Lawrence Manor went from Liberal to Conservative. This neighbourhood has a large Jewish population. Jews in the Greater Toronto Area have switched their votes en masse it seems in recent years from the Liberals to the Conservatives. I'm actually surprised that this switch didn't happen earlier in Lawrence Manor.

The NDP won just three polls in the riding.


Etobicoke Centre
Etobicoke Centre was the third closest riding in all of Canada. 26 votes separated the Conservative victor, Ted Opitz and the Liberal incumbent, Borys Wrzesnewskyj. The Tories won the seat, benefiting from a 5.7% swing from the Liberals. The Liberals had won the seat in 2008 by 5,700 votes.

In 2008, the Conservative support was strongest in the area of the riding east of Kipling and south of Eglinton. Liberal support was strongest north of Eglinton and west of the 427 and south of Rathburn Rd. The same can be said about the 2011 election, except that the Tories encroached on these Liberal areas.

In 2011, the Tories won all the polls between Kipling and Royal York Rd, south of Eglinton. This area includes the exclusive St. George's Golf & Country Club, and is fairly wealthy. The Tories also did well in the wealthy Humber Valley Village, and in Eringate (where they won 4 polls in 2008). The Liberals remained dominant north of Eglinton, where they won most of the polls. West of the 427 and south of Rathburn remained mostly Liberal, but the Tories made inroads there. Islington, in the central part of the riding went from a mostly Liberal area to a mostly Conservative area. The NDP won 4 polls in the riding, 3 of which were in the Mall area, along the 427.

Etobicoke--Lakeshore
Etobicoke--Lakeshore was the riding that Liberal leader Michael Ignatieff was defending. As the Liberals began struggling, the media started to speculate that hey may lose his seat. That indeed did occur. The Conservative candidate, Bernard Trotties won the seat by nearly 3,000 votes on an 8.3% swing from the Liberals.

Ignatieff won by nearly 6,000 votes in 2008, and nearly swept the riding. The Tories only won a handful of polls- mostly in the southwest part of the riding and in The Kingsway, an affluent neighbourhood in the northeast of the riding. The tables turned in 2011 however, where the Tories nearly swept the riding.

Party support is clearly distributed fairly evenly in the riding. In 2011, the Tories strength was pretty even across the district. South of the GO Train was their worst area, where the Liberals and NDP won many polls. The NDP and Liberals did very well in New Toronto, and the Liberals did well in Mimico. The Tories still did well in the area however, winning in Long Branch and in parts of Mimico.

Etobicoke North
Finally, we get to a riding where the Liberals were actually able to keep. The Liberals have held this working class riding since 1988. Liberal MP Kirsty Duncan won the seat by over 3,000 votes. A much closer margin than her 2008 victory of nearly 6,000 votes. In terms of poll strength, Duncan nearly swept the riding in 2008, with the Tories and NDP only winning a few.

In 2011, the Tories made some significant inroads in the riding, winning most of the polls south of the Humber River West. North of the river is the poorer community of Rexdale, which makes up the majority of the riding. Rexdale was nearly swept by the Liberals, enabling them to hold the seat. The NDP, which has held the seat provincially in the past won just 5 polls, 3 of which were in the Rexdale Mall area in the south end of the riding.

And that is all for now. I will analyze the other ridings in future posts..

Monday, July 18, 2011

2011 federal election poll maps: Nipissing--Timiskaming

The second riding I will profile since Elections Canada released the 2011 election poll by poll results is Nipissing--Timiskaming. This riding is located in Northeastern Ontario, and is largely centred on the City of North Bay. The riding extends as far north as the Municipality of Temiskaming Shores in the north which incorporates the communities of Haileybury and New Liskeard. The riding runs along the Quebec border past Mattawa, Ontario, and then south into Algonquin Park. The riding goes west to also include the communities of Powassan and Trout Creek.

Click on map to enlarge
Nipissing--Timiskaming was the second closest race of the 2011 election. It required a judicial recount to determine that the Conservative candidate, Jay Aspin had defeated the incumbent Liberal MP, Anthony Rota by just 18 votes. The riding, which for the most part is a descendant from the old Nipissing riding has been solidly Liberal since 1988. In fact, it had only voted Tory once since 1921. Provincially, the area is more of a bellwether, in that it has switched parties often. Nipissing was the riding of former provincial Premier Mike Harris.

While the Tories picking up the riding was seen as a surprise by many, it wasn't that far fetched. Rota had defeated his Conservative opponent by less than 5000 votes in the 2008 election. A 6.2% swing from the Liberals to the Conservatives gave the Tories the narrow victory.

The Tories won the seat by picking up polls across the rural parts of the riding from the Liberals. They also made inroads into North Bay, however the Liberals still won the city overwhelmingly. The Conservatives saw their strongest performance in the Anglo Protestant areas just south of Lake Nipissing, which includes the Township of Nipissing, and the communities of Trout Creek and Powassan. The Liberals' strongest areas were in North Bay, and mostly in the north end of the city, which has a high francophone population.

While the Conservatives gained 4.4% at the polls, the NDP increased their vote even more, going up 5% points. They won a few polls scattered across the riding. Four of these polls were won in the rural heavily francophone townships of East Ferris and Bonfield. While the NDP candidate didn't have a French name, the NDP surge in Quebec probably helped the party in the French communities of the riding. The best NDP poll was the Bear Island Indian Reserve. While the reserve is small, the poll is quite large, and is that large dark orange area on the west side of the riding.

The Liberals have traditionally done well among the French in this riding, but this has slipped in 2011. While the Liberals won in the French parts of North Bay, the lost in the french rural areas and towns, like in Mattawa, and Temiskaming Shores.

Poll map note: While the 2011 poll by poll shape files are available, I used the 2008 boundaries here. I don't have a working GIS program, so I have to trace over the 2008 poll maps at the Smufmatic website. That would also explain a slightly wonky projection in my map.

Sunday, July 17, 2011

Ontario election 2011 prediction (mid July edition)

A few days ago, Ipsos-Reid released a poll for the upcoming Ontario election that indicated the following:

Tories: 42%
Liberals: 31%
NDP: 22%
Greens: 5%

These numbers are slightly better for the Liberals than the Forum Research poll I discussed in my last prediction. This Ipsos-Reid poll was conducted over a month, beginning in early June while the Forum Research poll was held on one weekend in later June. This could explain the difference, but any ideas I come up with would be pure speculation.

Anyways, I realized that if I want to keep up with these polls, I have to use at least some mathematical methodology. At least until we have a better idea of what's happening in each local riding. This is why I am going to use a swingometre to help me with things for the time being. The swingometre is a tool used more in British and Australian elections to look at how swings in votes can result in seat changes. Because we use the same electoral system, we can use it here too. One problem with it is that it assumes a uniform swing to one party, which is never the case. But it will aid me for the time being, as I am not sure how local races will be affected at the moment.

 The Swingometre, explained

Here, I have two graphs. One shows the races that were Liberal vs. PC in the 2007 election and the other shows Liberal vs. NDP races. I included one seat where the NDP was a strong third in the lower graph as well. Each dot represents a seat. At the 0 mark in the middle are the results of the last election. If we move to the right of the mark, we assume a swing from the Liberals (to the Tories in the top graph and the NDP in the lower graph). The further right it goes, the more of those red dots will turn either blue or orange. I have not included a NDP vs. Tory graph, as there was only one race between those two parties. Also, there was one Tory vs. Green race that was not included.

The numbers represent the % swing. That is basically the average increase in support for one party compared to the average decrease of the other party. The Liberals won the last election by 10.6% of the vote. Therefore it would require a 5.3% swing to the Tories (the Liberals decrease their vote by 5.3% and the Tories increase it by 5.3% resulting in a tie). As you can see from the chart, this would only give the Tories 7 more seats, not enough to win the election. They need 28 seats to get a majority. This would require a swing of about 8.5% to the Tories, meaning that they could theoretically win the popular vote and still lose the election.

Luckily for the Tories, the latest Ipsos-Reid poll gives about an 11% swing to the Tories, which would give them 39 additional seats, well into majority territory. The poll also gives an 8% swing from the Liberals to the NDP, which translates to 9 additional NDP seats.

My new mid-July prediction will not be following the swingometre at verbatim. I still know enough about local voting habits to know that even with an 11% swing, certain seats will not fall. Also, some seats may fall which would require a greater than average swing.

Liberal vs. PC seats
The following is a list of Liberal held seats where the Tories finished 2nd in the last election, showing the swing the Tories need in order to pick up the riding. It also shows which party holds the seat federally which will help show us how realistic it is for that riding to vote Tory.


Riding Swing required (%) Federal Party
Nipissing 0.7 Conservative*
Barrie 1.5 Conservative
Kitchener--Conestoga 2.4 Conservative
Eglinton--Lawrence 2.7 Conservative
Ancaster--Dundas--Flaborough--Westdale 3.4 Conservative
Lambton--Kent--Middlesex 3.5 Conservative
Stormont--Dundas--South Glengarry 5.1 Conservative
Don Valley West 5.4 Conservative
London--Fanshawe 5.6 NDP
Oak Ridges--Markham 6.1 Conservative
Mississauga South 6.1 Conservative
Brampton West 6.3 Conservative
Willowdale 6.3 Conservative
Richmond Hill 6.5 Conservative
Prince Edward--Hastings 6.8 Conservative
Northumberland--Quinte West 7.1 Conservative
Scarborough--Guildwood 7.3 Liberal
Ajax--Pickering 7.4 Conservative
Mississauga--Erindale 7.4 Conservative
Perth--Wellington 7.4 Conservative
Oakville 7.4 Conservative
Etobicoke--Lakeshore 7.7 Conservative
Huron--Bruce 7.7 Conservative
Etobicoke Centre 7.9 Conservative
Niagara Falls 8.2 Conservative
Guelph 8.2 Liberal
York Centre 8.2 Conservative
Pickering--Scarborough East 8.5 Conservative
Bramalea--Gore--Malton 8.8 Conservative
St. Catharines 9.2 Conservative
Ottawa--Orleans 9.2 Conservative
Elgin--Middlesex--London 9.3 Conservative
Ottawa West--Nepean 9.4 Conservative
Brampton--Springdale 10.0 Conservative
Brant 10.1 Conservative
Kitchener Centre 10.2 Conservative
Ottawa South 10.2 Liberal
Scarborough Southwest 10.3 NDP
St. Paul's 10.4 Liberal
Peterborough 11.0 Conservative
Essex 11.5 Conservative
Chatham-Kent--Essex 11.6 Conservative
London North Centre 11.7 Conservative
Mississauga--Streetsville 11.8 Conservative
Kingston and the Islands 12.5 Liberal
Toronto Centre 13.8 Liberal
London West 14.1 Conservative
Mississauga--Brampton South 14.2 Liberal
Scarborough Centre 14.3 Conservative
Ottawa--Vanier 14.3 Liberal
Don Valley East 15.3 Conservative
Markham--Unionville 16.3 Liberal
Scarborough--Agincourt 16.4 Liberal
Glengarry--Prescott--Russell 16.7 Conservative
Etobicoke North 16.9 Liberal
Mississauga East--Cooksville 17.9 Conservative
Vaughan 21.6 Conservative
Scarborough--Rouge River 25.3 NDP
*Nipissing is part of the Nipissing--Timiskaming federal riding, which has different borders.

As you can see from this chart, even the "safest" provincial Liberal seats are not that safe at all. Their three "safest" seats are held by different parties in federal parliament.

Liberal vs. NDP seats
The following is a list of Liberal seats where the NDP finished 2nd in the last election. I have also included London--Fanshawe, where the NDP was a close third place.
Riding Swing required (%) Federal Party
Thunder Bay--Atikokan 0.1 NDP*
York South--Weston 0.7 NDP
Timiskaming--Cochrane 1.2 N/A*
Hamilton Mountain 1.9 NDP
Ottawa Centre 2.0 NDP
Davenport 2.7 NDP
Algoma--Manitoulin 2.8 NDP*
Thunder Bay--Superior North 4.3 NDP*
London--Fanshawe 6.2 NDP
Windsor West 12.3 NDP
Windsor--Tecumseh 12.9 NDP
York West 13.4 Liberal
Sudbury 15.8 NDP*
Sault Ste. Marie 16.9 Conservative*