Friday, June 20, 2014

June 30 Federal by-election profiles: Scarborough--Agincourt

Location of Scarborough--Agincourt in Toronto
Federal by-elections will be held in four ridings on June 30th: two in Ontario (Scarborough—Agincourt and Trinity—Spadina) and two in Alberta (Fort McMurray—Athabasca and Macleod). I will be doing profiles of each of the four ridings in the run-up to by-election day. Today I will be profiling Scarborough—Agincourt.

Scarborough—Agincourt is a suburban riding located in the northwest corner of the former city of Scarborough in the east end of Toronto. It has been vacant since its long-time MP Jim Karygiannis resigned in April to run for city council in Toronto. Karygiannis – a Liberal – has held the seat since the riding was created in 1988.


Geography


Scarborough—Agincourt is shaped like a fat “L”, its northern border being formed by Toronto's northern city limits (Steeles Ave), its western border being Victoria Park Avenue (Scarborough's former western limit), its southern border being the 401, and its eastern border being a line following (from north to south) Midland Avenue, Finch Avenue and Brimley Road. The riding covers four main neighbourhoods: Steeles, L'Amoureaux, Tam O'Shanter – Sullivan and part of its namesake, Agincourt. Agincourt itself was once a small village located at the corner of Midland Avenue and Sheppard Avenue.

For a suburban riding, Scarborough—Agincourt is quite densely populated, as it is home to many apartment, condominium and retirement complexes. Most of the riding is covered in suburban subdivisions built in the 1960s and 1970s. The only main non-residential areas are industrial areas in the northwest and northeast corners of the riding, and a number of parks and parkland, the largest being the L'Amoureaux Sports Complex and the Tam O'Shanter Golf Club.


Demographics


The riding is notable as being one of the most Chinese ridings in Canada. In fact, it is the second most Chinese riding in the country and the most Chinese riding in Ontario. Nearly half (47%) of its residents are Chinese, and just one in five (21%) are White. The riding also has a large South Asian population (14%) and Black population (5%). Chinese is also the first language of a plurality of inhabitants. 42% of residents have a Chinese language as their mother tongue, while only a third (33%) of inhabitants have English as their first language. Tamil is the largest South Asian language, with 5% of residents having that language as their mother tongue. 43% of the riding is Christian, with Catholics and “Other Christians” making up most of that population. There are also significant numbers of Hindus (8%), Muslims (6%) and Buddhists (6%). 37% of the riding has no religion. The riding is one of the poorer ridings in the country. The median income in the riding is $21,000 while the median household income is $55,000.

Plurality racial group by Census Tract
Chinese is the plurality race in most of the riding, except for the southwestern corner (the neighbourhoods of Sullivan, Corinthian and Bridlewood) where Whites form the plurality. Only in one census Tract do Whites form the majority of the population. Chinese is the majority race in the north (Steeles) and in the east (Agincourt) part of the riding. In one census tract, Chinese is the race of 100% of the population (this area only consists of a Chinese long term care facility).


History


Scarborough—Agincourt was created in the 1987 redistribution when its massively over populated predecessor riding of York—Scarborough was divided into two ridings (Scarborough—Agincourt and Scarborough—Rouge River). Part of York—Scarborough was also carved into the then-new riding of Don Valley North. Its first election in 1988 featured Liberal candidate Jim Karygiannis – a Greek immigrant who had previously run for the Liberals in the 1987 provincial election – against W. Paul McCrossan, the Progressive Conservative incumbent MP for York—Scarborough. The 1988 election would be the closest Karygiannis would come to losing, as he only beat McCrossan by 858 votes. Karygiannis would win with large majorities in every subsequent election until 2011, where he beat his Conservative challenger, Harry Tsai by 4500 votes and a 45% vote share. Some of Karygiannis' victories were quite massive. His biggest electoral win was in 2000, when he won 70% of the vote, defeating his next best rival, Canadian Alliance candidate Andrew Faust by 22,000 votes.

The history of what is now Scarborough—Agincourt follows the history of the Township of Scarborough until post World War II suburbanization fragmented the township (later the city of Scarborough) into multiple ridings. For much of its history, Scarborough was fairly rural, and was grouped with neigbouring rural townships.


MPs 


York East (1867-1904)

From Confederation until 1904, Scarborough was lumped with Markham and East York into the riding of York East.

- Jas. Metcalfe, Liberal (1867-1878)
- A. Boultbee, Cons. (1878-1882)
- Hon. A. Mackenzie, Liberal (1882-1892)
- W.F. Maclean, Ind. Cons. (1892-1904)


York Centre (1904-1911)

In 1904, Scarborough was moved into York Centre, a horseshoe-shaped riding encircling Toronto, containing Scarborough, Markham, Vaughan and Etobicoke.

- A. Campbell, Liberal (1904-1907)
- P.D. McLean, Liberal (1907-1908)
- T.G. Wallace, Cons. (1908-1917)


York East (1917-1925)

As the townships around Toronto became more populous, the ridings in the area became numerous. In 1917, Scarborough was joined with part of the east end of Toronto to become the riding of York East.

- Thos. Foster, Unionist (1917-1921)
- J.H. Harris, Cons. (1921-1925)


York South (1925-1935)

In 1925, Scarborough joined the riding of York South, which saw a dramatic boundary change, but retained its MP. The riding contained Scarborough and East York.

- W.F. Maclean, Ind. Cons. (1925-1926) 2nd time
- R.H. McGregor, Cons. (1926-1935)


York East (1935-1953)

In 1935, Scarborough was moved into the new riding of York East, which also contained Markham and East York.

- R.H. McGregor, Prog. Cons. (1935-1953) continued


York—Scarborough (1953 -1988)

In 1953, York—Scarborough was created, initially consisting of the east half of North York, most of Scarborough and part of Markham. In 1966, it shrunk to just contain the northwest quarter of Scarborough and part of North York. In 1976, the riding grew larger, taking in all of the northern half of Scarborough and part of North York. The southern boundary was shifted northward to balance the population. However, the riding remained hugely overpopulated, with 80,000 people casting ballots in in 1978. The riding continued to grow, and in its last election in 1984, 100,000 people had voted. During its existence, the riding was a perfect bellwether, voting for the party that formed government in every election (a by-election in 1978 notwithstanding).

- F.A. Enfield, Liberal (1953-1957)
- F.C. McGee, Prog. Cons. (1957-1963)
- M.J. Moreau, Liberal (1963-1965)
- R.D.G. Stanbury, Liberal (1965-1978)
- W.P.J. McCrossan, Prog. Cons. (1978-1980)
- P.J. Cosgrove, Liberal (1980-1984)
- W.P.J. McCrossan, Prog. Cons. (1984-1988) 2nd time


Scarborough—Agincourt (1988-present)

Since York—Scarborough had become too large, it divided into two ridings. The western part of the riding became Scarborough—Agincourt. From 1988 to 2000, the riding was rectangular in shaped, being bounded by Steeles Avenue, the CNR, Ellesmere Road and Victoria Park Avenue. In 2004, its southern and eastern boundaries were altered to its present state.

- Jas. Karygianis, Liberal (1988-2014)


Future


Following the redistribution which will come into effect in next year's election, Scarborough—Agincourt's boundaries will only be altered slightly. The part of the riding east of Midland Avenue will be transferred to the new riding of Scarborough North. The result makes the riding very slightly more Liberal and less Conservative.


Political geography


2011 election results by polling division
In the 2011 election, Karygiannis won most of the riding easily. However, a number of apartment complexes in the Tam O'Shanter neighbourhood went so overwhelmingly Conservative, that the Tory candidate ended up winning the neighbourhood by a thin margin (hard to tell from just looking at the map). The area just south of Tam O'Shanter Golf Club has regularly been the most (or only) Conservative part of the riding in recent elections. This area includes the “Shepherd Village Christian Community”, a Pentecostal seniors' apartment complex. A poll covering this complex even voted for the Canadian Alliance in 2000. In the 2011 federal election, the Whiter parts of the riding - in the southwest - were slightly more Conservative than the rest of the riding. However, in the provincial election held last week, this area was more Liberal than the rest of the riding. Could it be that the Chinese community is trending conservative like it is in other parts of the country? Generally though, despite the large ethnic polarity in the riding's demographics, it does not show up much in voting patterns. The strongest neighbourhood for the Liberals in 2011 was L'Amoureux, but the 47% of the vote they won there was not much different from any other neighbourhood. The NDP is not much of a factor in the riding. They just won one poll (and tied another) in 2011, both polls in those apartment complexes south of the Tam O'Shanter Golf Club.

2011 federal election results by neighbourhood

Strongest polls (2011):

Liberals: Poll #430 (66%) - This poll corresponds to one of the Royalcrest Condominiums at 45 Huntingdale Blvd in L'Amoureaux. The Liberals won all three of the Royalcrest Condos, but 45 Huntingdale was their best.

Conservatives: Poll #424 (75%)- This poll corresponds to one of the Shepherd Village Christian Retirement buildings on Bonis Avenue in Tam O'Shanter. No surprise that a Christian retirement community would be strongly conservative.

NDP: Poll #449 (39%) - This poll corresponds to one of the apartments on Carabob Court, also in Tam O'Shanter. This was the only poll the NDP won in the riding, but the NDP tied in another poll (#100) covering a Carabob Court apartment.


Weakest polls (2011):

Liberals: Poll #424 & #429 (17%) - Both of these polls cover the Shepherd Village Christian Retirement building. Enough said.

Conservatives: Poll #61 (12%) - This poll covers the Finch Birchmount Apartments (2821 Birchmount Rd), which is operated by Toronto Community Housing in L'Amoureaux, so it is basically a social housing project. Understandable why the Conservatives wouldn't do well in such a place.

NDP: Poll #424 (7%) - One of the Sheppherd Village Christian Retirement buildings.


2008 - 2011 swing


Two party (Liberal vs. Conservative) swing (2008-2011) by polling division
The 2011 election saw a 8.01% swing from the Liberals to the Conservatives in the riding. The stronger swing to the Conservatives came in the Tam O'Shanter area and in the northwest part of the riding. Interestingly, the White areas of the riding (in the southwest) saw less of a swing. But overall, there isn't much to say in terms of finding demographic patterns in the swing data. Most of the riding swung towards the Conservatives, while only a few isolated polls swung to the Liberals.


Outlook 


The Liberals are hoping to retain this riding, and are running a candidate of Chinese ancestry in a hope to win the seat. They are running Willowdale lawyer Arnold Chan. If he wins, he would be the riding's first MP of Chinese background. The Conservatives missed the boat by not running someone of Chinese origin. They are running local teacher Trevor Ellis. Like the Liberals, the NDP is also running a lawyer of Chinese ancestry – Elizabeth Long – who is an immigrant from Wuhan, China. The Greens are running Shahbaz Mir.

In the lead up to the last federal election, the Tories did a great job in reaching out to minority communities – especially the Chinese community – by appealing to their social conservatism. With Liberal leader Justin Trudeau's recent hardline pro-choice stance on abortion, now would have been a great opportunity for the Conservatives to pick up this riding. It could still go Conservative though, as the Chinese community has had no problems re-electing Jim Karygiannis over and over again despite his lack of Chinese ancestry. But it makes it that much harder for the Tories by not running a Chinese candidate.

A Forum Research poll conducted in mid-May showed that the race will be a lot closer than one might expect. It showed that Chan had just an 8-point lead over Ellis (46-38). The NDP's Elizabeth Long was at 9% and the Greens at 2%. I would not be surprised if the poll is close to the actual election results. The riding's strong Liberal history both provincially and federally cannot be ignored here, and with the Liberals doing well in Canada-wide polling, it stands to reason they will likely win once again on by-election night. However, the real wild card will be how much the Tories can successfully tap into the Chinese vote.  We shall see.

Thursday, June 12, 2014

2014 Ontario Election - FINAL PROJECTION

Final projection map
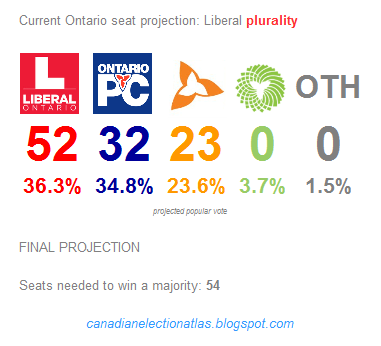
It's finally election day in Ontario, and that means my final projection of the campaign. All the pollsters have released their final polls, which they got in before the midnight publishing deadline, last night. The trend that most of the polls show is that the Liberals are headed for a modest victory in the popular vote. If we average all the polls released yesterday (from Abacus, Ipsos, EKOS, Angus Reid, Forum Research and even Leger), the Liberals would win 36.1% of the vote, the Tories would win 32.7% of the vote, the NDP would win 24.7% and the Greens would win 5.2%. This would be a small loss (-1.5%) in the popular vote for the Liberals, who won 37.6% of the vote in 2011. But it would be an even bigger loss (-2.7%) for the Progressive Conservatives, who won 35.4% last election. The NDP and the Greens would see an increase in their vote share if the polls are correct, with the NDP up +2.0% and the Greens up +3.3%.

The Liberals' narrow win in the popular vote in 2011 was enough to come just one seat short of a majority. In stands to reason that if they increase their popular vote lead over the Tories, that they could theoretically win a majority this time. However, the NDP is the real wild card in this election. The NDP has been polling all over the place in the last few weeks of the campaign. Just yesterday, Ipsos had the NDP at 30% province wide, but EKOS on the other hand had them at 19%! A whole 11 point difference. How well the NDP does could mean the difference between a majority and a minority for the Liberals, because a lot of the seats the NDP would win with a high popular vote (as opposed to say, 19%) would come at the expense of the Liberals.

For my final projection, I inputted the regional polls from Angus Reid, Ipsos, Forum Reasearch, Abacus and EKOS (Leger didn't have any regional numbers). I also made a few last minute tweaks to my model, so that I could come up with a result that I would be comfortable with. The first change I made was to alter the poll numbers to reflect my own projected turnout model. I did this by looking at previous election results, and comparing them to the polls conducted prior to them. I found that in Ontario elections, there is a small “shy Tory” effect, which has resulted in the Tories often under-polling in elections. The opposite is true for the NDP, which often over-polls in elections. The Greens also under poll, while the Liberals usually poll consistently with actual election results. I took a look at the ratio of poll results vs. Real results from the last election, and applied it to my model to project the popular vote outcome for this election. I figured, the two elections are very similar, in that there is a somewhat unpopular Liberal government that appears to to be heading for re-election, but with the outcome of a majority or minority still in doubt. Therefore, turnout will likely be similar to the 48% in 2011, or even less - because this election is in June - when many people could be away (while the 2011 election was in October).

The second major change I made to my model was to alter the data in a few select seats, to even them out with recent riding polls conducted by Forum Research. I was noticing due to polls conducted by Forum Research in Trinity-Spadina and Davenport - that I had inputted into my model - that the NDP numbers in my model were higher there than in “safer” NDP seats in Toronto, like Parkdale-High Park and Beaches-East York. So, I boosted the NDP numbers (at the expense of the Liberals) in the latter two ridings, so that my model projected a higher NDP vote share in those ridings than in Davenport and Trinity-Spadina. I made a similar shift in the Waterloo region, by boosting Liberal numbers in Kitchener Centre and Kitchener-Conestoga, due to polls conducted in Kitchener-Waterloo and Cambridge showing higher than expected Liberal numbers. And I also boosted Liberal numbers in the main swing ridings of the 905 region, due to a higher than expected Liberal poll result in Burlington. The 905 ridings I boosted Liberal numbers were in Halton, Thornhill and Newmarket-Aurora. It stands to reason that the Liberals will do better than projected in other 905 ridings, but I felt it was most important to focus on those three ridings, since they are the most likely to flip to the Liberals in the region (closest in my model).

After all the changes I made, my model has shown the Liberals are projected to win 52 seats, which would be just two short of a majority. This would be a decline of one seat from 2011, but a gain from the 48 they held at dissolution. For the Tories, my model shows them winning 32 seats, which would be a disaster for the party, as they won 37 seats in 2011, and had 38 at dissolution. If this were to happen, one could logically expect their leader, Tim Hudak to resign. And finally, my model shows the NDP winning 23 seats, which would be a very good result for the New Democrats, who won 17 seats in 2011, and had 21 at dissolution.


For this projection, I am going to analyze each of Ontario's regions separately, so to also give a preview of what to look for on election day.

Ridings in seat charts are coloured by how they voted in 2011.

Toronto

Toronto's five lakefront ridings that are held by the NDP (Parkdale-High Park, Davenport, Trinity-Spadina, Beaches-East York and Toronto-Danforth) will be key seats to watch today. Recent poll numbers from the city show NDP numbers to have recovered from mid-campaign to the point where they could win all five seats once again. However, Forum Research polled Davenport and Trinity-Spadina almost 2 weeks ago, and showed the Liberals to be leading in both ridings. This was at the lowest point in the polls for the NDP in Toronto, which is why my model now shows the NDP ahead in both ridings. But with polls all over the place, the Liberals could win up to four of the five NDP held seats (Toronto-Danforth is probably safe). The only shift in seats my model shows in Toronto is Etobicoke-Lakeshore. That riding was won by the Liberals in 2011, but picked up last summer in a by-election by the Tories. My model shows the Liberals regaining the seat.


Southwest

Recent polling suggests there could be an NDP surge in the southwest, which has resulted in my model showing the NDP holding all of their current seats in the region, plus Windsor West (which a Forum Research poll showed they were ahead in), which would be a gain from the Liberals. One key seat to watch in the region to measure NDP fortunes is Kitchener-Waterloo. Forum Research did a poll in the riding, showing the Liberals narrowly ahead of the NDP in the riding. If there is an NDP surge however, it means the NDP will probably win it. This would be a hold for the New Democrats who won it in a by-election from the PCs in 2012. Another race to watch to measure NDP fortunes would be London West. Forum showed the party ahead there (but it was close), so losing it would be bad news for New Democrats.

There are a number of Liberal vs. PC races in the region to watch for as well. My model currently shows the Liberals gaining one seat from the Tories (Cambridge), and the Tories gaining one seat from the Liberals (Brant). Forum Research had a poll showing the Liberals way ahead of the Tories in Cambridge, which has never voted Liberal in its history. In Brant, the election was very close there in 2011, and the Tories are running a former MPP. Brant is actually the only riding in the province that I have the conservatives picking up from their opponents. Other Liberal vs. PC races to watch in the region include Kitchener Centre (an open seat, close last time) and Kitchener-Conestoga (if Liberal gains in Cambridge come true, there could be Liberal gains in this neighbouring riding as well).

If you're a Green supporter, then you'll want to watch Guelph, to see how their leader Mike Schreiner does.


Eastern

Toward the end of the campaign, it looked like the Progressive Conservatives were going to make big gains in the east, perhaps picking up as many as three or four seats from the Liberals, which would spoil any chance of a Liberal majority government. However, recent polling suggests the Liberals have recovered in Eastern Ontario, which could mean a status quo result, like my projection shows. Forum Research polled two key ridings in the region: Ottawa West-Nepean and Glengarry-Prescott-Russell. Both showed a narrow Tory lead. However, that was when the conservatives were polling very strong in Eastern Ontario. With the Liberals now coming on strong, it stands to reason that they could hold on to those two seats. Another seat in the region, Ottawa-Orleans will also be key, as it is an open seat and was very close in 2011. In my opinion, the Liberals need to hold onto all of their seats in the region to win a majority.


North & Central

There is probably just one seat to watch in this region, and that is Sudbury. Sudbury was a very close race between the Liberals and the NDP in 2011, and with the Liberal incumbent retiring, it means the seat is the NDP's to lose. And there have been two riding polls that have shown the NDP to be ahead with a decent margin. My model reflects these poll numbers, which is why I have the NDP gaining Sudbury. Forum Research also did a riding poll in Thunder Bay-Atikokan which saw the Tories coming on strong. In 2011, it was a close Liberal-NDP race, so this would be a huge shock if it came true.


905 belt

The 905 region, which surrounds Toronto is almost always the most important political region in the province. The region is the province's bellwether, swinging to and fro depending on the political winds of the time. The region is also the most populous in the province, being home to 33 ridings. There are a number of key ridings in the 905, which will be pivotal for the Liberals to win if they hope to form a majority government.

For the Liberals, they need to win all of the seats they hold right now in the region, and make some pick ups. My model currently shows them gaining Burlington, Halton, Newmarket-Aurora and Thornhill from the Tories. This may be enough to win a majority if the Liberals can gain seats in Toronto, and hold onto their seats in Ottawa, and elsewhere. Another riding that could flip Liberal is Northumberland-Quinte West, where they are running a former MPP who lost the seat in a close race in 2011. They also have an outside shot at Bramalea-Gore-Malton, which the NDP won in 2011, but is not an historically NDP riding.

For the Tories to save face in the election, they need to make gains in the 905. But my projection doesn't show them doing so. Losing seats would be a disaster for the PCs. The only gains they have an outside shot at making would be Brampton-Springdale, St. Catharines and Oakville (from the Liberals) and Niagara Falls (from the NDP). But all riding polls have shown the Tories are trailing in key 905 ridings.

For the NDP, there is an outside shot of winning Oshawa, but I wouldn't hold my breath on that one.


Conclusion

If polls are to be believed, than this race is the Liberals' to lose. The main story line to watch for tonight is whether or not they can win a majority government of at least 54 seats. For this to happen, the Liberals need to hold almost all of their current seats (acknowledging a couple of losses here and there), and gain enough back, and then some. To do this, they need to win seats in the 905 from the Tories, and in the 416 (Toronto) from the NDP. My gut feeling is that the election will come down to whether or not the Liberals can make these gains in Toronto. This election might just come down to the downtown voters who have jumped the NDP ship due to being uncomfortable with the party's (new found?) populist rhetoric.

We'll know for sure after 9pm tonight, when the polls close. 


 Methodology

The basis of my model extrapolates the results of the 2011 election using regional polling averages from recent polls. If a party is polling at double the level they won in 2011, then that party would see its support double in each riding in the region my model (that is, if they won 5000 votes in a riding, they would be projected to win 10000). I have also taken into account recent by-elections (only in the case where a non-incumbent part won), but projecting the results of the by-elections backward to the last election based on poll numbers from around the time of each by-election. That is, if a party did 5 points better than polls indicated they would've won in a by-election, then I have made their 2011 result 5 points more than they actually received in 2011.


I've also made numerous tweaks in the model where I've felt appropriate, to boost particular candidates, or to use estimates based on recent federal election results. Also, I have inputted riding specific polling for ridings that have been polled during the campaign (and altered nearby similar ridings to match the same shifts). Please refer to previous blog posts for more details.

Monday, June 9, 2014

2014 Ontario election projection - June 9

June 9 Projection Map
We're now just three days away from Thursday's provincial election in Ontario. As expected, a whole slew of new polling data has rolled in, and yet we're still no clearer to knowing what's going to happen as we were last week. Last week, it looked like the Liberals were poised to break away from the Tories into a comfortable lead- perhaps enough to win a majority. However, all the most recent polls suggest the race is now a dead heat between the two parties.

For today's projection, I've inputted three new polls into my model, conducted by EKOS, Ipsos and Forum Research. EKOS Research's is the most recent poll in my model, released this morning as part of their daily tracking poll. They show the Liberals and Tories tied – exactly – right down to the decimal point (35.9 – 35.9). It also shows the NDP dropping back to 17.6%, a drop of 2.9% since their previous poll released, Saturday. Most of that drop has helped the Liberals, who are up 1.7% since Saturday, while the Tories are up 0.4% since Saturday. Meanwhile, Ipsos' poll, released Friday, also shows the two parties tied, at 35% a piece. However, they have the NDP with a much better standing, at 26%! And Forum Research alsoshows a close race, with the Liberals up by two points over the Tories (39% - 37%). Their NDP numbers are closer to EKOS's numbers, giving the party just 17%.

While Ipsos' methodology is questionable (opt-in online panel), their numbers appear to be more in tune to the other pollsters than previous polls they conducted (poll which showed the Tories ahead, while the other polling firms had the Liberals ahead). However, Ipsos' NDP numbers seem way too high compared to EKOS and Forum Research (a whole 9 point difference). Ipsos polled over 2000 people in their survey, which has meant that my model (which weights by sample size) is heavily reliant on their poll, which means my model's results may be slightly skewed towards their results.

In addition to their province-wide poll, Forum Research also published 18 riding polls on Friday, most of which were conducted the previous weekend (May 31-June 1). I've inputted these polls into my model, which has resulted in many of the my projection's seat changes since Friday. I inputted the riding polls with the polling conducted over the weekend they were conducted, so my model's numbers in those ridings will be slightly different from the polls themselves, taking into account polling trends over the last week.

Here are the results of Forum's 18 riding polls and my commentary:

Davenport: Liberal 44%, NDP 38%, PC 11%, Green 5%. This confirms that the NDP slide in Toronto has put their current seats in the city in jeopardy. However, it's still close, and thanks to poll movements over the last week, my model now shows the NDP back on top here.
Etobicoke-Lakeshore: Liberal 49%, PC 39%, NDP 7%, Green 4%. Recent rumours have indicated that the Liberals were leading in this riding, which the Tories won in a by-election last summer. This poll confirms these rumours. Without this riding, the Tories will likely be shutout in Toronto.
Trinity-Spadina: Liberal 37%, NDP 36%, PC 19%, Green 8%. I had thought this riding would be the first to go for the NDP if the Liberals were to gain any seats at their expense this election (close race in 2011). This poll shows the NDP may have a better shot to hold this seat than in Davenport.
Windsor West: NDP 41%, Liberal 34%, PC 18%, Green 5%. It's not all bad news for the NDP, as this would be a pickup from the Liberals, who currently hold this riding. With Windsor West being such a pro-incumbent riding, the best chance for the NDP to win the riding was in 2011, when the seat was open. But they are running a much stronger candidate in this election, and the Liberal incumbent has only been in office for one term.
Cambridge: Liberal 42%, PC 29%, NDP 16%, Green 9%. When a previous projection I made showed the Liberals ahead in Cambridge, I credited it as being a strange result, and quickly fixed it. However, I shouldn't have if this poll is correct. It would be a huge gain for the Liberals, who have never held the riding in its 40 year history. The result is possible, as the race between the Liberal candidate and the Tory incumbent is a re-match which was very close last time (2000 vote difference).
Kitchener-Waterloo: Liberal 35%, NDP 33%, PC 24%, Green 7%. Forum polled three of the ridings that the NDP picked up in recent by-elections, and this is the only one of those where the NDP is losing, but by just 2%. It looks like the Liberals are doing quite well in the Waterloo Region (as evidenced by the poll in Cambridge as well).
London West: NDP 35%, PC 31%, Liberal 29%, Green 3%. The big NDP by-election win in this riding last August seems to have been no fluke, but the race is a very close three way race. The Liberals polling at 29% seems to be a surprise, considering they only won 16% in the by-election, but they did win the seat in 2011.
Glengarry-Prescott-Russell: PC 45%, Liberal 41%, NDP 10%, Green 3%. This poll confirms the increase in Tory support in Eastern Ontario is for real, and it means PC pickups at the expense of the Liberals. So while the Liberals are making gains elsewhere in the province, they could lose up to 3 seats in the Ottawa area.
Ottawa South: Liberal 46%, PC 41%, NDP 9%, Green 4%. While the Tories are way up in Eastern Ontario, they aren't quite polling high enough to win this longtime Liberal riding, which was won by then-Premier Dalton McGuinty in 2011. Forum had the Tories way ahead in the August by-election in this riding, even though the Liberals ended up winning it. So it's possible this poll result indicates a Liberal landslide in Ottawa South!
Ottawa West-Nepean: PC 45%, Liberal 38%, NDP 12%, Green 4%. The Tory increase in Eastern Ontario has meant that they have enveloped this riding as well, which was extremely close in 2011.
Thunder Bay-Atikokan: Liberal 38%, PC 30%, NDP 19%, Green 9%. Forum also polled this riding earlier in the campaign, which showed the Liberals way ahead, but the NDP in 2nd. The Tories polling in 2nd place would be a huge surprise, considering recent close election results between the Liberals and NDP. I checked electionprediction.org to see if there was any evidence of a strong Tory campaign here, but most are suggesting the poll is a fluke. While I inputted this poll as is, I may try and keep the Liberals ahead within the margin of error based on this qualitative assumption (note how close it is in this projection due to recent polling!).
Sudbury: NDP 44%, Liberal 36%, PC 15%, Green 4%. This poll result confirms a previous poll conducted at the beginning of the campaign by OraclePoll which also showed the NDP winning. This seat was won by the Liberals last time, but is an open seat. The NDP winning would be no surprise, since the party holds it federally.
Pickering-Scarborough East: Liberal 49%, PC 35%, NDP 11%, Green 4%. No surprise here, as the riding is a safe Liberal seat. Not sure why Forum bothered to poll it.
Brampton-Springdale: Liberal 38%, PC 34%, NDP 19%, Green 4%. This riding is probably the PC's best shot at picking up a seat in the Peel Region (as it is currently an open seat, which the Conservatives won by a large margin in the federal election), but this poll shows they are trailing. The NDP has targeted the riding by running a popular member of the Sikh community. (The riding has similar demographics to neighbourhing Bramalea-Gore-Matlon which the NDP won in 2011 by running a popular member of the Sikh community). It's possible the NDP is under-polling here thanks to the low response rate among visible minorities to polls.
Burlington: Liberal 42%, PC 41%, NDP 13%, Green 4%. If the Liberals win in Burlington, it would be a huge pickup at the expense of the Tories. The Tories have never lost an election in Burlington since the riding was created in 1975. And if the Liberals are ahead here, it could mean other big gains in the 905 (like Newmarket-Aurora, Halton and Thornhill to name a few) where they have more of a history.
Mississauga-Erindale: Liberal 47%, PC 34%, NDP 13%, Green 3%. A fairly safe Liberal seat, so no surprise they are way ahead.
Niagara Falls: NDP 44%, PC 34%, Liberal 16%, Green 4%. If this poll stays true, it would end Niagara Falls' bellwether streak which dates back to 1985 (it has voted for the winning party in every election since then). The NDP picked up the seat in a close by-election earlier this year, so it was thought that out of all the ridings the NDP has picked up in recent by-elections, this would be the first to fall. However, this poll seems to indicate the opposite.
St. Catharines: Liberal 46%, PC 27%, NDP 21%, Green 5%. Liberal MPP Jim Bradley has held this seat since 1977, and this poll has him winning yet again. The race in 2011 was a close one, with Bradley defeating his PC opponent by just 1700 votes, but this poll says it wont be close again.


Projected seat changes (since Friday)

All of those riding polls threw a large wrench in my model, shifting the numbers in nearby ridings as well, creating for a plethora of seat changes in my model. Not to mention the regional polling changes as well. In all 12, ridings have changed hands compared to Friday, but the result was only a net gain of two seats for the NDP at the expense of the Liberals (no change for the Tories):

York Centre: PC to Liberal
Davenport: Liberal to NDP (riding poll was closer than expected, plus strong numbers for the NDP in the Ipsos poll in Toronto)
Etobicoke-Lakeshore: PC to Liberal (riding poll)
Trinity-Spadina: Liberal to NDP (riding poll had the Liberals up by just one)
Cambridge: PC to Liberal (riding poll)
Kitchener-Waterloo: NDP to Liberal (riding poll)
Windsor West: Liberal to NDP (riding poll)
Burlington: PC to Liberal (riding poll)
Halton: Liberal to PC
Newmarket-Aurora: Liberal to PC
Northumberland-Quinte West: Liberal to PC
Thornhill: Liberal to PC

If the Liberals end up winning Davenport and Trinity-Spadina, and pick up two of those 905 seats that flipped back to the Tories (Halton, Newmarket-Aurora, Northumberland-Quinte West and Thornhill), then they will have won a majority. This appears to be the most likely path to a majority right now for the Liberals. For the Tories, the path to a majority seems to be too difficult to attain (where are they going to win 18 more seats?). 

Here are my projected numbers for each seat. Ridings are coloured by how they voted in 2011:


Methodology
The basis of my model extrapolates the results of the 2011 election using regional polling averages from recent polls. If a party is polling at double the level they won in 2011, then that party would see its support double in each riding in the region my model (that is, if they won 5000 votes in a riding, they would be projected to win 10000). I have also taken into account recent by-elections (only in the case where a non-incumbent part won), but projecting the results of the by-elections backward to the last election based on poll numbers from around the time of each by-election. That is, if a party did 5 points better than polls indicated they would've won in a by-election, then I have made their 2011 result 5 points more than they actually received in 2011.


I've also made numerous tweaks in the model where I've felt appropriate, to boost particular candidates, or to use estimates based on recent federal election results. Also, I have inputted riding specific polling for riding that have been polled during the campaign. Please refer to previous blog posts for more details.

Friday, June 6, 2014

2014 Ontario election projection - June 6

There are now just six days left until the June 12th Ontario election, and just when I thought the Liberals were heading for certain victory, a new EKOS poll released this morning suggests this race is still anything but certain. The poll is part of EKOS Research's daily tracking of the Ontario election, and now shows the Tories with a narrow lead, albeit within the margin of error.

Current projection map


EKOS poll results: (change from yesterday's poll)

Prog. Cons.: 34.9% (+4.0)
Liberal: 33.9% (-1.8)
N.D.P.: 20.5% (+0.7)
Green: 8.4% (-1.2)
Other: 2.3% (-1.7)


I've now entered this poll into my projection model, replacing yesterday's EKOS tracking poll. I also removed the Ipsos poll from last Thursday, which is now more than a week old. The effect on the projected popular vote is negligible, since the Ipsos poll also showed the Tories ahead. Now the only two polls used in my projection are the Abacus poll from last Monday, and this morning's EKOS poll. 

Despite the boost in Tory fortunes across the province, my new projection actually shows the Liberals gaining a net three seats from the Progressive Conservatives. This is due in large part to an increase in Liberal support in the very important "905" region of Ontario, which surrounds Toronto. This morning's EKOS poll shows the following numbers in that region:

(Change from yesterday's poll) 

Liberal: 37.1% (+3.0)
Prog. Cons.: 30.0% (-0.2)
N.D.P.: 20.4% (-0.6)
Green: 9.8% (+1.7)
Other: 2.7% (-5.0)


This shift was enough to flip four ridings in my model from the Tories to the Liberals: Halton, Newmarket-Aurora, Northumberland-Quinte West and Thornhill. My model has previously shown the Liberals ahead in Northumberland-Quinte West, but never in the other three ridings. When my model did show the Liberals up in Northumberland-Quinte Went, I characterized it as a strange result, as I believe the region has been trending conservative. While I still think it's likely to go PC on election day, it's not inconceivable that the Liberals could win the riding back, as they are running former MPP Lou Rinaldi who held the seat for 8 years from 2003 to 2011. Halton is another surprise result in my projection, since the seat has been held by Tory Ted Chudleigh since 1995. However, recent election results have the riding trending Liberal, with the result from 2011 giving Chudleigh a narrow 3000 vote lead over his Liberal challenger, Indira Naidoo-Harris. Chudleigh and Naidoo-Harris are squaring off this time once again, so it should be close. My projection in Newmarket-Aurora may seem like a surprise as well, since it has been held by Tory Frank Klees since 1995. However, he is not running again, leaving the seat open. I feel if it wasn't for the popularity of Klees, the riding would likely be a bellwether - and now that it is an open seat, it could possibly go to who ever wins the election. And as for Thornhill, its high Jewish vote has made the riding a lean-conservative riding in recent elections. However, if enough of the non-Jewish vote goes Liberal, the Grits could pick this one up. 


Another significant shift in the EKOS poll, was in the City of Toronto- where the Liberals have slipped at the expense of the Tories. That has resulted in one riding in my model flipping from Liberal to Progressive Conservative: York Centre. This has created a very unlikely scenario of York Centre going Tory in my projection, while its more Jewish neighbour, Thornhill is going Liberal (part of the reason York Centre is one of the most conservative leaning ridings in Toronto is because of its high Jewish population). At this point, I feel it is unlikely York Centre will go to the Tories. We'll see what future poll numbers in Toronto say.

Here is the EKOS poll regional breakdown for Toronto (change from yesterday):

Liberal: 43.3% (-3.8)
Prog. Cons.: 31.0% (+5.0)
N.D.P.: 16.7% (+1.9)
Green: 6.9% (-4.7)
Other: 2.1% (+1.6)


(One reason why the Tories are polling higher than expected and why the NDP and Liberals are polling lower may have to do with a lot of people with 416/647 cell phone numbers do not actually live in Toronto, but in the 905 region surrounding the city. It is impossible do determine where a person with a cell phone lives, unless they are asked.)


Here are my projected numbers for each seat. Ridings are coloured by how they voted in 2011:


Methodology
The basis of my model extrapolates the results of the 2011 election using regional polling averages from recent polls. If a party is polling at double the level they won in 2011, then that party would see its support double in each riding in the region my model (that is, if they won 5000 votes in a riding, they would be projected to win 10000). I have also taken into account recent by-elections (only in the case where a non-incumbent part won), but projecting the results of the by-elections backward to the last election based on poll numbers from around the time of each by-election. That is, if a party did 5 points better than polls indicated they would've won in a by-election, then I have made their 2011 result 5 points more than they actually received in 2011.


I've also made numerous tweaks in the model where I've felt appropriate, to boost particular candidates, or to use estimates based on recent federal election results. Please refer to previous blog posts for more details.


Thursday, June 5, 2014

2014 Ontario election projection - June 5

With EKOS now providing daily tracking polls of the Ontario election, and with projection model (nearly) complete, I can provide daily (or near-daily) projections of the Ontario election. Right now, we are just 7 days away from the June 12th vote. 

Since my projection yesterday, EKOS has released two daily tracking polls (yesterday afternoon and this morning), so for today's projection, I factored in the poll released this morning. This morning's EKOS poll shows a slight narrowing in the race, compared to previous EKOS tracking polls. It shows the Liberals with a five-point lead over the opposition Progressive Conservatives (35.7% - 30.9%), and the NDP recovering as well, now at 19.8%. Here is a summary (change from yesterday afternoon's poll / change from two days ago):

Liberal: 35.7% (-0.7% / -3.1%)
Prog. Cons.: 30.9% (-0.1% / +0.4%)
N.D.P.: 19.8% (+0.5% / +2.0%)
Green: 9.6% (+1.2% / +1.2%) 
Other: 4.0% (-0.9% / +0.5%)

I have also removed last week's Forum Research poll from my model, which is now more than a week old. This has meant that despite the EKOS tracking poll showing the Liberals down slightly and the Tories up slightly, my model shows an increase in Liberal support, and a decline in Tory support. This is because the Forum poll had the two parties tied. 


The big movements in my model have come in the 905, where the Liberals have increased their numbers at the expense of the Tories, and in the Northern & Central region, where the opposite has happened. These changes have flipped two ridings in my model since yesterday: Haliburton-Kawartha Lakes-Brock and Oshawa. I expressed my concerns yesterday about Haliburton-Kawartha Lakes-Brock going Liberal (as my projection had shown), but this most recent shift has given the riding to the Tories, with a reasonable margin too: 41% - 33%. Oshawa is a bit of a surpise. My model now shows the NDP on top once again. With Tory fortunes down in the 905 (and the NDP holding its own), Oshawa going to the NDP may not be so far fetched, but I have a hard time fathoming it still. To sum from yesterday, the Liberals are down a net one seat, the Tories are even, and the NDP is up one.

 Here are my projected numbers for each seat. Ridings are coloured by how they voted in 2011:


Methodology
The basis of my model extrapolates the results of the 2011 election using regional polling averages from recent polls. If a party is polling at double the level they won in 2011, then that party would see its support double in each riding in the region my model. I have also taken into account recent by-elections (only in the case where a non-incumbent part won), but projecting the results of the by-elections backward to the last election based on poll numbers from around the time of each by-election. That is, if a party did 5 points better than polls indicated they would've won in a by-election, then I have made their 2011 result 5 points more than they actually received in 2011.
I've also made numerous tweaks in the model where I've felt appropriate, to boost particular candidates, or to use estimates based on recent federal election results. Please refer to previous blog posts for more details.


Wednesday, June 4, 2014

2014 Ontario election projection - Week 5

Week 5 projection map
There are now just 8 days remaining until election day in Ontario, and with the lone debate of the campaign occurring yesterday, it can be safely said that the finish line of the provincial election is within sight. Over the last week, we have seen a little bit of movement in the polls, with the Liberals ever so slightly increasing their lead over the Progressive Conservatives. Both EKOS Research and Abacus Data have shown the Liberals to have at least a seven-point lead in the polls. Forum Research – which hasn't released a poll since May 28 – has the two parties tied, while Ipsos – which is using an opt-in panel – continues to show the Tories ahead, but by just two points. Ipsos has been the lone polling company to show the Tories consistently ahead in this campaign, and it may be due to their (flawed) methodology. As a pollster myself, it is my professional opinion that Ipsos' decision to use their opt-in panel (that is, their survey respondents are members of their survey panel, one in which they have volunteered to join, rather than a probability based panel) has made their numbers unreliable. But in the name of consistency, I have decided to include their numbers in my model anyway (as I have been doing). Abacus Data, Ipsos and Forum all have the NDP in the low-20s, while EKOS has begun to show the New Democrats south of the 20% mark.

This week's projection takes into account the most recent EKOS poll released last night (EKOS is now doing a daily tracking poll), Abacus' poll released Monday, Ipsos' poll released last Thusday and Forum's poll released a week ago. It does not take into account recent polls released by OraclePoll and Nanos Research, which lack regional breakdowns. The average of the four pollsters show the Liberals with a narrow 1.4% lead over the Tories, slightly smaller than what they had in the last election. The NDP is averaging at 21.3%, which is a small decrease from the last election (where they won 22.7%). The Greens are continuing to poll quite high, and are averaging at 6.8%, which is a proportionally large increase from the 2.9% they won in 2011.

In terms of seats, my model shows the Liberals at 50, just shy of the 54 they need to win a majority, and a decrease of three seats from what they won in 2011. The Progressive Conservative Party is at 39 seats, an increase of two from 2011 and the NDP is at 18, an increase of one.

For this week's projection, I made a major change in my model in an effort to make it more accurately depict likely election outcomes. Last week I added estimated vote totals based on recent federal results in ridings where an incumbent lost in 2011. I continued with this idea to apply estimates in ridings that were open seats (no incumbents) in 2011 as well as seats that are open seats for this election. The idea being that not having an incumbent on the ballot dramatically changes the election results of the seats in question. Using federal vote results in these ridings I believe is the best way to estimate how these seats will go in this election, rather than using previous provincial results which I feel skew the model towards previous incumbents that are no longer on the ballot. Seats that were open in 2011 included Carleton-Mississippi Mills, Glengarry-Prescott-Russell, Stormont-Dundas-South Glengarry, Barrie, Bruce-Grey-Owen Sound, Pickering-Scarborough East, Scarborough-Agincourt, Don Valley East, Davenport, Mississauga East-Cooksville, Burlington, Welland, Cambridge, Chatham-Kent-Essex, Elgin-Middlesex-London, Essex, Windsor West, Kenora-Rainy River, Nipissing and Timiskaming-Cochrane. In some of these cases, I was unable to find a suitable estimate using federal results (often due to the federal riding having different candidate dynamics than their provincial counterparts or the provincial result in 2011 being close enough to the federal results in the riding). In these cases, I did not provide any estimates in my model, and I continued to use the 2011 result as the base. In the ridings of Glengarry-Prescott-Russell, Stormont-Dundas-Glengarry, Pickering-Scarborough East, Don Valley East, Davenport, Welland, Essex, Windsor West, Kenora-Rainy River, Nipissing and Timiskaming-Cochrane I made no changes in my model.

I also applied federal election result-based estimates in seats that are open races for this election. This affected Ottawa-Orleans, Durham, Newmarket-Aurora, Etobicoke Centre and Brampton-Springdale. In three open ridings (Kingston and the Islands, Kitchener Centre and Subdury), I ignored federal results. For Kingston and the Islands and Kitchener Centre, I found recent federal election results were not suitable for the projection, and in Sudbury, I am continuing to use an estimate based on a riding-poll released earlier in the campaign by OraclePoll.

And if that wasn't enough of a change in my model, I also looked at three ridings where an incumbent who lost in 2011 is running again. Taking a look at ridings where this happened in the last provincial election (only one case, Paul Ferreira in York South-Weston) as well as where it happened in Ontario in the last federal election (8 such cases), I calculated the average decrease in percentage of the vote (compared to the provincial average), and discovered that candidates who were incumbents in the previous election on average lost 1.22% of the vote more than the province-wide swing. I used this number to knock of that percentage for candidates where this applies to in this election (and redistributed it to the other parties based on how the candidate's losses were redistributed in the last election). This affected my model in three ridings: Haliburton-Kawartha Lakes-Brock (where Rick Johnson is running), Northumberland-Quinte West (Lou Rinaldi) and Bramalea-Gore-Malton (Kuldip Kular). All three of those candidates were MPPs who lost in 2011, but are running again this time.

And finally, I made one small tweak in Guelph, where I boosted Green Party leader Mike Schreiner's numbers. I took a look at the swing in Green vote in the last election in the riding of Simcoe-Grey (where he ran in 2011), and compared the change of Green support in that riding to the provincial average swing for the Green Party and applied this difference to Guelph, where he is running this time. I also reversed this increase in Simcoe-Grey, as Schreiner is not running there again.


Projected seat changes (since last week)

Due to the major changes in my model, there have been quite a few ridings changing hands since my last projection a week ago. Also, there have been many shifts due to the polls changing. The Liberals have had a net change of zero seats, the Tories are up five seats, and the NDP is down five seats. The Liberals have gained Beaches-East York, Davenport, Parkdale-High Park and Trinity-Spadina from the NDP (due to the NDP's numbers dropping dramatically in Toronto) as well as York Centre and Haliburton-Kawartha Lakes-Brock (despite the change in my model reducing Liberal numbers there) from the Tories. On the flip side, the changes in my model, as well and increase in their poll numbers in Eastern Ontario have given the Tories some seats that my last projection had going Liberal. These seats are Cambridge, Glengarry-Prescott-Russell, Ottawa-Orleans, Ottawa West-Nepean, Northumberland-Quinte West and Barrie. In addition, the Tories are now ahead in Oshawa, which my model had going NDP last time.


Strange results

The aim of the major changes in my model was to reduce the number of strange results that had been showing up in my previous projections. However, there are still some strange results. The recent EKOS poll released yesterday showed the Liberals way up the Northern and Central Ontario, which has put Haliburton-Kawartha Lakes-Brock into the Liberal column, which I feel unlikely at the moment. Even after changing my model to reduce Liberal support in the riding, it still shows the Liberals ahead. Future polls will likely correct for this, however. Also, recent regional polling shows the Tories up in Eastern Ontario which has Tories sweeping the three marginal Liberal-held seats in the region (Glengarry-Prescott-Russell, Ottawa West-Nepean and Ottawa-Orleans). While the Tories picking up any of these seats isn't strange per se, having them win all three might be so. Similarily, regional polling has the NDP down in Toronto, which has meant my model showing the current NDP-held seats of Davenport, Trinity-Spadina, Parkdale-High Park and Beaches-East York going Liberal. Again, it wouldn't be a surprise for the Liberals to win any of these seats, but sweeping all four seems to be unlikely.

Here are my projected numbers for each seat. Ridings are coloured by how they voted in 2011:


Methodology

The basis of my model extrapolates the results of the 2011 election using regional polling averages from recent polls. If a party is polling at double the level they won in 2011, then that party would see its support double in each riding in the region my model. I have also taken into account recent by-elections (only in the case where a non-incumbent part won), but projecting the results of the by-elections backward to the last election based on poll numbers from around the time of each by-election. That is, if a party did 5 points better than polls indicated they would've won in a by-election, then I have made their 2011 result 5 points more than they actually received in 2011.

I've also made numerous tweaks in the model where I've felt appropriate, to boost particular candidates, or to use estimates based on recent federal election results. Please refer to this blog post or previous posts for more details.